Summary Findings

This is my last posting in this Climate Change Blog! Lots has been discussed, lots has been learned, and challenges have been undertaken. In this last blog post, I will summarize all of my previous blog posts to bring it all together.

First, I spoke about the definition of climate change. Where most people assume that using “global warming” is a beginning and end all catchment term, it is the exact opposite. Climate and weather are two separate parts of the equation. Climate change is a more apt term to use, in essence, climate change is measuring the same areas or taking the same temperature readings over multiple years / decades. Carbon foot prints are the sum energy used between production and consumption, this includes refining, storing, transporting, car miles, and consumption of items.

Next, causes of climate change were discussed. There is a lot to cover, and in a small, blog-style format, mentioned a few main causes of man-made climate change. major offenders of climate change were laid out, with the usual suspects topping the charts: China, U.S.A, India, Russia, Japan rounded out the top 5.

The main sources of man-made climate change are carbon dioxide (co2), methane, nitrous oxide, and fluorinated gases. Carbon dioxide is the worst offender, being responsible for 64% of man-made GHG, methane is 17%, and nitrous oxide 6%. Water vapour is the largest naturally occurring GHG. Reasons for these emissions were detailed in my first and second climate change blog postings. Chlorofluorocarbons were also discussed in the climate change cause blogs, they’re synthetic in nature, and are highly regulated via international agreements to mitigate their problematic destruction of the ozone layer.

There are of course, climate change deniers (some go as far up as the Oval Office), but the facts are pretty straightforward when it comes to empirical evidence that supports climate change.

Next, impacts on the environment were laid out and discussed, I won’t go into detail here, but the most devastating and common impacts in climate change are:
– more extreme weather conditions
– more drought and more flooding
– less ice and snow
– rising sea level

My climate change professor challenged me to change something about my life for a week and report on the findings. I decided that since I am doing 10 small blog posts instead of 10 larger ones, that I could squeeze in a little bit more and decided to go with 3 lifestyle changes spread out over 3 weeks, and report on the findings. Inside each these blog posts, I laid out the differences in a easy to read, form, with metrics to determine the outcome.

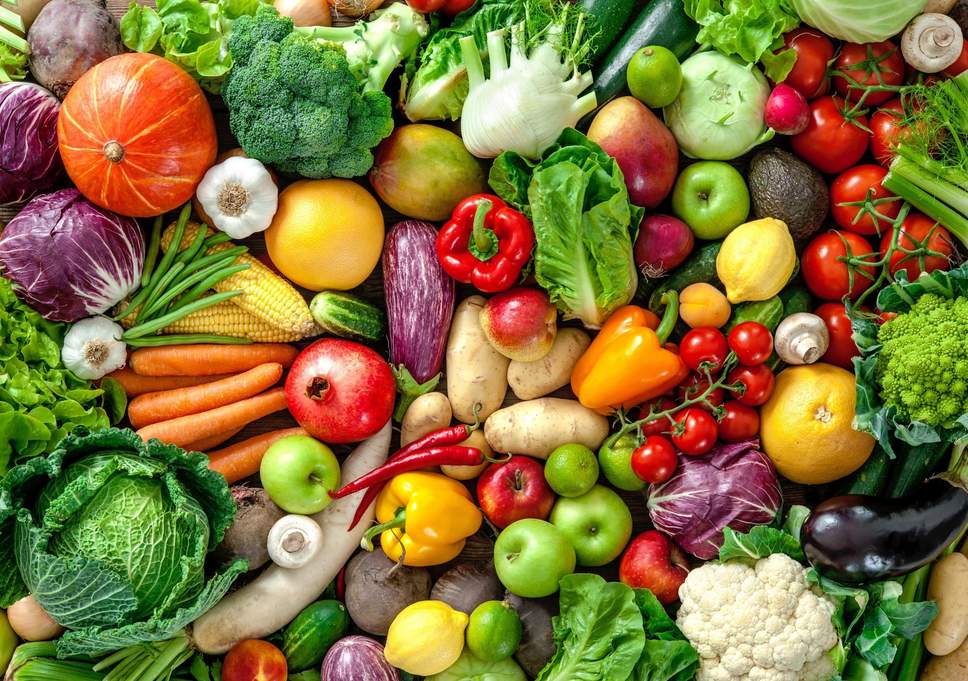
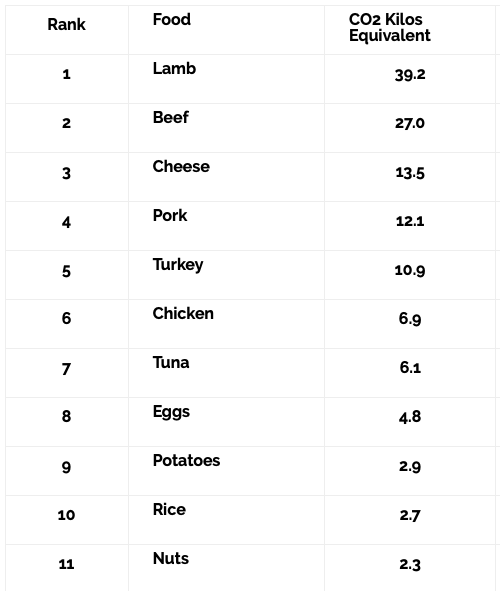
Week 1 saw me ditch my car for a week in favour of using public transit, and spoke about the average consumption that I used in my car, and the results of changing to a car-free life, albeit much longer travel times and more annoying, it probably saved the planet for one extra day. Week 2 saw me unplugging everything I did not need to use in my home, to save electricity from keeping chargers plugged in, and keeping electronics in standby mode, and recorded the data given to me from BCHyrdo live usage data website. Week 3 saw me change my eating habits to an all vegetarian / vegan. This was undertaken to cut down on the ‘food miles’ and the co2 emitted by each type of food. The results were pretty dramatic.

Then again, maybe we just need more time? Nobody questions the link between smoking and cancer anymore, because the science has been proven and research has been done for over 50 years. Climate change science is relatively new in the cultural zeitgeist and until it can be proved beyond a reasonable doubt (in climate-change deniers eyes), then it won’t be universally accepted. I however, am convinced.

This class, as well as the previous geology class I took at Capilano University, taught me new concepts. I went in blind, not knowing the first thing about water, the inherent water crisis, and climate change. While I held a basic understanding that indeed the climate is changing, I lacked the specific knowledge that has been imbued onto me from this course.

Lifestyle Change #3 and Results

As part of my learning contract, I agreed with Chris to change something about my life and report on the findings from this life change. I decided to, in fact, change three things about my daily life, chosen by me, and make a blog post every week about these changes, how they impacted my environment, and the facts regarding these three changes.

This weeks lifestyle change was suggested by a co-worker. She suggested that I could change my diet for a week to cut down on the amount of ‘food miles’ my food has had to travel to get to me, and lower the carbon footprint of the food that I eat.

When we talk about carbon footprint of food, it includes all emissions produced on the farm, in the factory, on the road, in the shop, and in your home. The example retrieved from http://www.greeneatz.com/foods-carbon-footprint.html states that it takes an equivalent 63 miles ‘car miles’ to produce one kg of beef. Meat, cheese, and eggs have the highest carbon footprint, while fruit, vegetables, beans and nuts have a much lower carbon footprint. If you move towards a largely vegetarian / vegan diet for a week, I can have a large impact on my personal carbon footprint.

via http://www.greeneatz.com/foods-carbon-footprint.html

The above chart is the amount of kilograms of co2 that enters the atmosphere per kilogram of food produced. Being that my diet is high in beef, cheese, pork, chicken, eggs and potatoes, I decided to cut most of these out as much as possible, or trim these down a lot. Here are the results for the week before, and the week after:

 BeforeCO2 kg Car MilesAfterCO2 kgCar Miles
Beef3kg811890.25kg6.7515.75
Cheese0.5kg6.7515.50kg00
Pork2kg24.2560kg00
Chicken2.5kg17.25401kg6.916
Eggs1.25kg613.751kg4.811
Potatoes3kg8.7211kg2.97
Total12.25143.90335.253.2521.3549.75

As noted in my previous blog post about cutting down my co2 from ditching my car for a week, I was genuinely interested to see what a small change in my lifestyle (going to a more vegetarian / vegan diet) would do for the environment. You can see by the results above that the equivalent amount of car miles has been cut down by over 285, and the amount of equivalent co2 dropped by about 122.25. It does amaze me at the small changes I make in my life can have lasting effects.

Next week, to wrap up the blog, I will post a summary blog that recaps everything I’ve posted over these three months.

Lifestyle Change #2 and Results

As part of my learning contract, I agreed with Chris to change something about my life and report on the findings from this life change. I decided to, in fact, change three things about my daily life, chosen by me, and make a blog post every week about these changes, how they impacted my environment, and the facts regarding these three changes.

Lifestyle change #2 is actually a lot easier to implement. I once watched a special on TV of ‘greening’ a celebrities home. This piqued my interest as the cost savings and the savings to the planet are huge in scale and scope. When you think about your own consumption, and according to the Energy Star website, the average household spends more than $100 each year to power devices that are turned off. Nationally, this accounts for more than 100 billion kilowatt hours and more than $10 billion in wasted energy costs each year.

A very easy way to combat this was to unplug all the devices I was currently not using. I found this very easy as I live in an old apartment, and so there are few plugs to choose from. I unplugged all my power bars when I would go to school, and plug them back in when I got home, or when I needed the devices.

Week 1, before any changes made

What I noticed via my live consumption via the BCHydro website is that my kWh usage dipped each day. Each day I unplugged all of my power hogging devices that sit in standby until I come by and power it on. Above is week 1 before I changed any of my habits.

Week 2, after changes were made

Above is week 2, I typically keep the same work schedule and same school schedule, you can see a change across the board. Most days I cut my kWh in half, and this saves money. The estimated cost for week 1 was $6.50 for power (estimated from BCHydros site) and the week after was $4.89. Not an intense drop, but when you compare it to a yearly rate. $6.50 per week is $338 per year. and if I am diligent I can bring it down to approximately $254.28 per year. A savings of approximately $85 per year. If we had more people do this, we would be able to save millions of dollars per year and thousands of kg’s of GHG in the atmosphere.

Next week, I will discuss the 3rd lifestyle choice change I made 🙂

Lifestyle Change #1 and Results

As part of my learning contract, I agreed with Chris to change something about my life and report on the findings from this life change. I decided to, in fact, change three things about my daily life, chosen by me, and make a blog post every week about these changes, how they impacted my environment, and the facts regarding these three changes.

For week 1 of a lifestyle change, I decided to ditch my car for a week and bus back and forth to Capilano University

The average passenger car emits 4.6 metric tons per year of carbon dioxide into the atmosphere. This assumes a 22.0MPG consumption rating. My car is slightly less efficient at 21.89MPG average, or 13L/100km. The car, albeit a 4 cylinder, turbo-charged vehicle, is a tuned performance vehicle and only burns the really expensive Chevron 94, and I have a happy foot when I drive it. If I only go to school in one day, I drive 32km per day, If I go to work after school, I drive 50km per day.

This chart shows the amount of co2 pumped into the atmosphere from cars, in comparison to busses.

By eliminating passenger car co2 emissions in my own life, I can save approximately 6.3x less as public transit emits 6.3x less co2 into the atmosphere. One thing to note is that a bus must have 19 passengers on it to be economically viable, but what some people do not realize is the more people on a bus, the better it is for the environment. According to BC Green Care, if you share a ride to and from a location, you can (on average), save 3.72kg of ghg, and that exponentially goes up if there is more people in the car.

However, this solution for me is problematic, Capilano U is about a 40 minute drive for me, and using public transit is almost out of the realm for me. Night busses are hard to come by at Cap, especially getting back into downtown. However, I can say that the lifestyle choice research was an absolute success, because I saved money, and greenhouse gas emissions.

Next week, I will talk about my second lifestyle change and what I learned from it.

Climate Change: Impacts (2/2)

This blog is a continuation of the previous weeks blog, global climate change impacts. In this second blog, I will wrap up some of the most important consequences of climate change, this weeks blog will focus on:

– less ice and less snow
– sea level rising

Less ice and less snow is a major concern with climate change. Some areas of the world depend on water from melting snow and ice to fill their reservoirs and the lack of water from this source can deliver severe droughts to people who depend on this water. To be completely selfish, I love the snow, and each year I see less and less of it (to be fair, I live on the west coast, where I barely see any anyway, but am still saddened by it). As discussed a few times already in this blog series, the snow, melting at a faster pace, or having very little snow, creates pockets of land that absorb heat, instead of sending it back into the atmosphere, which increases the amount of feedback, in this case rising temperatures in the atmosphere, to compensate. It is reported at 1/6 of the earths population is dependent on meltwater.

Rising sea level is the final topic I will discuss in this blog. Melting glaciers and melting snow cause the sea level to rise. Another key factor in the sea level to rise is thermal expansion. When water gets warmer, it expands.

via epa.gov

The chart above shows the average increase in sea temperature as reported by the Environmental Protection Agency in the U.S.A. between the years 1901 and 2015.

As the sea level rises, cities and countries can be impacted, where areas of the world that are at sea level or just above sea level, could become submerged. Islands in the pacific are expected to lose partial or total land mass by the end of the 21st century. This will also have an impact on the local wild and marine life, as their ecosystem will dramatically change, potentially causing extinction in some plant and animal species. This will also reduce the amount of space for humans to live and work, potentially causing more armed conflicts as living space gets smaller and smaller. The increase in standing water will lend itself to disease as the water will now be closer to civilization, and for countries with poor water conditions, this could be particularly dangerous.

That’s the end of these blogs describing the impacts of global climate change, next week, I will discuss the challenge presented to me by my instructor for this course.


Climate Change: Impacts (1/2)

These next two blogs will switch gears and focus on how climate change impacts the world around them. These blogs will focus on these topics:

– more extreme weather conditions
– more drought and more flooding
– less ice and less snow
– rising sea level

This first blog will go over the first two, and the second blog will go over the second two.

More extreme weather conditions is something people do not understand when it comes to climate change. People just assume the nomenclature, global warming, which was misaligned to the true nature of climate change, is the beginning and end all. The general (non-educated to sound bougie), public just assumes that the earth should be getting hotter, when the the opposite could be true. What actually happens is that the extremes are intensified on both ends of the spectrum. The warmer climate makes the Earth more susceptible to more intense, more frequent heatwaves, create much more violent rainfall and raise the number of or the intensity of storms / hurricanes / other forms of extreme weather patterns.

More drought and more flooding is the next topic. As stated above people just assume the Earth is getting hotter and this will mean hotter summers and shorter winters, while this is not completely wrong, its a wrong assumption to make. When the Earth gets warmer, feedback in the atmosphere causes water vapour to increase, resulting in potential more intense precipitation in the rainy months. It doesn’t always fall where it is created, and can create intense droughts in areas where the evaporation isn’t compensated by more precipitation. Think of areas in the middle east, they will soon lose their water supply, and some areas in South Africa have been warning about a zero day where every drop of water would have to be imported for their citizens (Capetown, South Africa).

In some areas of the world, farmers rely on this precipitation to water their crops and for irrigation , without this water, crop failure and potentially famine would result. Conversely, with high amounts of extra rainfall caused by this feedback, it will only get more intense and cause more flooding in these regions.

With drought and flooding, there is always a chance of disease running rampant. In a previous course, GEO 330 – Water Changes Everything, I learned that there are water-borne diseases, and when there is drought, the ecosystems shrink and only the fittest survive. These smaller bodies of water become a breeding ground for disease, and in developing nations, where they routinely drink dirty water, this creates an increased hazard to their daily lives.


In next weeks blog, I will discuss the other two impacts of climate change, less ice and less snow, and the rising sea level.

Climate Change Causes (2/2)

This weeks blog is a continuation of last weeks blog, so if you haven’t read it, go read it!

The average temperature across the globe has raised by 0.85C higher than in the 19th century. Lots of people do not understand the impacts of climate change, and that will be discussed in a future blog post.

To continue where I left off, another perpetrator of global climate change and a big contributor is Chlorofluorocarbons (CFCs). CFC’s are synthetic in nature and are created via industrial production. These are now largely regulated with international agreements (Paris Accord, etc.) to mitigate their destruction of the ozone layer. They are categorized as a greenhouse gas.

Last but not least, water vapour, which mentioned in the previous blog, are the largest contributor of greenhouse gas. Water vapour acts as feedback, what I mean is that when the earth gets warmer, the water vapour increases in size, as well as clouds and precipitation. This part is a byproduct of climate change and happens naturally. Without the intervention of man, the Earth would not have this variation in the feedback loop.

But how do we know that the Earth is warming? Any search of google would come with a million results at a simple search, and there are many climate change deniers in the world, even as far up as the oval office have buffoons that believe that it’s Chinese made (like some bloody Christmas toy), but if we look towards the science, we can come up with plenty of empirical evidence to support the facts. Some of these are, but are not limited to:
– the past 16 years have been the warmest on record year over year
– basic chemistry states that if you burn carbon based materials, CO2 is emitted
– measuring CO2 in glaciers via drilling can determine the rate of carbon thats trapped inside.
– physics that show us that CO2 absorbs heat
– and most importantly, consensus amount scientists that global climate-change is in fact happening.

Maybe we just need time? Nobody questions the link between smoking and cancer anymore, because the science has been proven and research has been done for over 50 years. Climate change science is relatively new in the cultural zeitgeist and until it can be proved to a reasonable doubt (in climate-change deniers eyes), then it won’t be universally accepted. I however, am convinced.

Climate Change Causes (1/2)

This blog and next week’s will be focused on the causes of climate change. The causes of climate change are many and it would be hard to cover it in a small, blog style format. This first blog will go over the general stats of man-made climate change.

One of the reasons why we use the term ‘greenhouse gas’ is that these gases get caught in the atmosphere and stop the suns heat from escaping the earth, creating a greenhouse effect. Many of these gasses occur naturally, but interference from man has created elevated levels of these gases, in particular:
carbon dioxide
methane
nitrous oxide
fluorinated gases

CO2 is the most common man-made greenhouse gas and is responsible for 64%, while methane is responsible for 17% and nitrous oxide is 6%. Water vapour is the largest natural greenhouse gas. One of the biggest offenders of greenhouse gas is the burning of fossil fuels, and cutting trees that absorb carbon dioxide, sending more of it into the atmosphere. The atmosphere acts as a big blanket, and with clearcutting of trees, the absorption rate of the surface land diminishes and sends the sun rays back into the atmosphere where they can be trapped.

More causes of global climate change, as mentioned above, are increased livestock farming, which is where a large portion of methane comes from (from cows farting), fertilizers containing nitrogen, because they produce nitrous oxide emissions, and fluorinated gasses, which produce an impact on the atmosphere 23,000 times that of CO2.

Feedback is another concept that is determined to help contribute to global climate change. When typically snowy parts of the earth melt earlier and earlier each year, the suns rays are absorbed rather than sent back via reflection, this results in the earth absorbing the heat and the atmosphere warming up in a positive feedback response.

Next week, I will continue the discussion on causes of global climate change.

The Usual Suspects

facts show that 75% of people like pie charts

It should be no surprise that when we talk about man-made climate change and the amount of CO2, the industrialized countries are the perpetrators. The Paris Climate Agreement signing ceremony took place in April of 2016, and it bound nations to a long term agreement to help mitigate the speed of climate change by making changes to attempt to attain a goal of 2 degrees C per year, with a stretch goal of 1.5 degrees C per year, enhancing sinks and reservoirs in an attempt to combat the global water crisis that is currently underway, and many other goals.

The data above from Wikipedia is data from 2016. The usual industrialized suspects are noted in the top ten but what is more surprising is the amount that is produced by international shipping and international aviation. I wouldn’t have thought they would have come into let alone be #10 and #12 respectively.

The data was picked from 2016 as a baseline for comparison. Most countries that signed onto the Paris Agreement are still in, while the most notable country that pulled out of the agreement was the United States. You can see from the data above that there is a long way to go to mitigate the impact of man made climate change, and to align itself with the goals set forth. One notable problem with the Paris Agreement is that member countries agreed to monetary punishment for not meeting goals, and it’s a point of contention for countries of different economic strength as to how big these penalties will be, who they have to pay, and even if they have legal jurisdiction to enforce these penalties. If I were to guess, most western countries who have the money to pay, will, but those who don’t, won’t. At any rate, the discussion of climate change and most countries coming to an agreement that something must be done, is a step in the right direction

Over the next couple of weeks, I will write about man-made climate change, vis a vis what has caused it.

Carbon Footprint?

The term has been dropped thousands of times, but do you really know what a carbon footprint is? The term is horribly misused and abused by eco-nuts who want to use scare tactics to get us to change our ways and habits. I didn’t know until I committed to writing this series of blog posts to determine exactly what it is, where it came from, and how it is applied to our daily lives.

The term carbon footprint was first coined by Prof. William Rees in a 1992 paper published in the journal, Environment and Urbanization. It is defined as (loosely) as the sum total of man-man climate change emissions for a certain activity, an item, lifestyle, a company, country, etc.

Global warming is another term that is freely thrown around without much science to back it up, the more apt phrase is climate change. Carbon footprints generally describe a certain amount of man-made greenhouse gasses emitted into the atmosphere, the highest being carbon dioxide, which is emitted when fossil fuels are burned for any activity, industry, etc.

To break it down slightly further, there are sources of direct, and indirect carbon footprints as well, generally referred to as carbon toe prints. An example of direct carbon footprints is the fuel that the car burns, and the indirect source would be the refining, storing and transporting of the fuel to be put into the car, as well as the manufacturing process for the car itself.

This series of blog posts is geared towards educating both myself and the reader on carbon footprints, issues in carbon offsetting, and many other topics that I will delve into, next, I will briefly talk about the higher end perpetrators.